Installation
The easiest way to install is from the development version from Github:
If there are any issues/bugs, please let me know: github. You can also contact me via my website.
Overview
statr is a personal R package that I have created for organizational/convenience purposes. This project is purely experimental!!! A (possibly incomplete) list of functions contained in the package can be found below:
-
tidy()tidy’s R package code and updates documentation -
CVsplit()splits data objects into training and testing sets -
data_gen()generates data for linear regression settings -
dense()generates dense matrices -
denseQR()generates dense matrices via spectral decomposition -
tridiag()generates tri-diagonal matrices -
derivative()approximates the derivative for a given function -
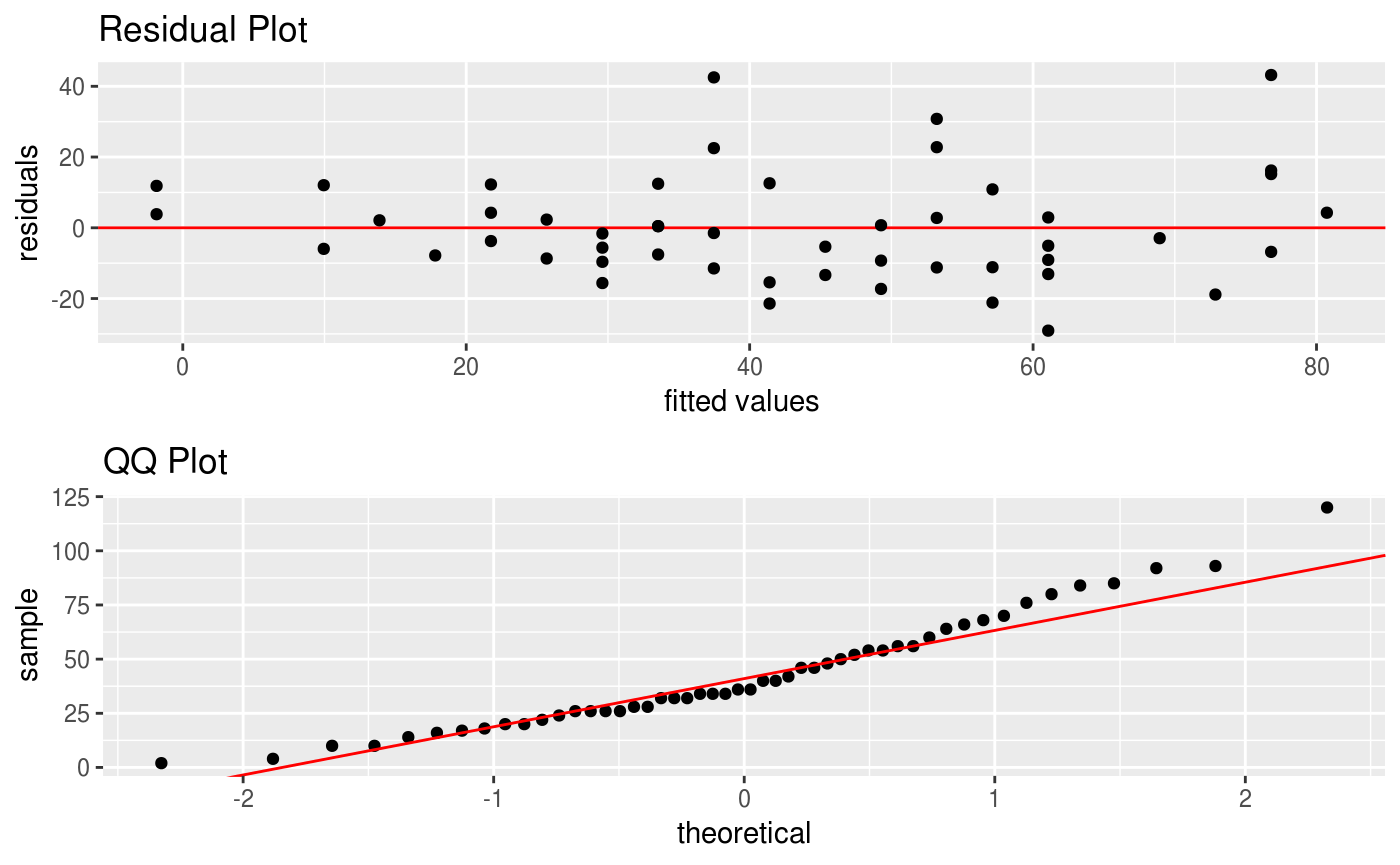
diagnostic()creates diagnostic plots using ggplot (residual and QQ) -
dsearch()is a dichotomous search algorithm for minimizing a univariate function -
bsearch()is a bi-section search algorithm for minimizing a univariate function -
LASSO()calculates lasso regression coefficient with optimal tuning -
RIDGE()calculates ridge regression coefficient with optimal tuning -
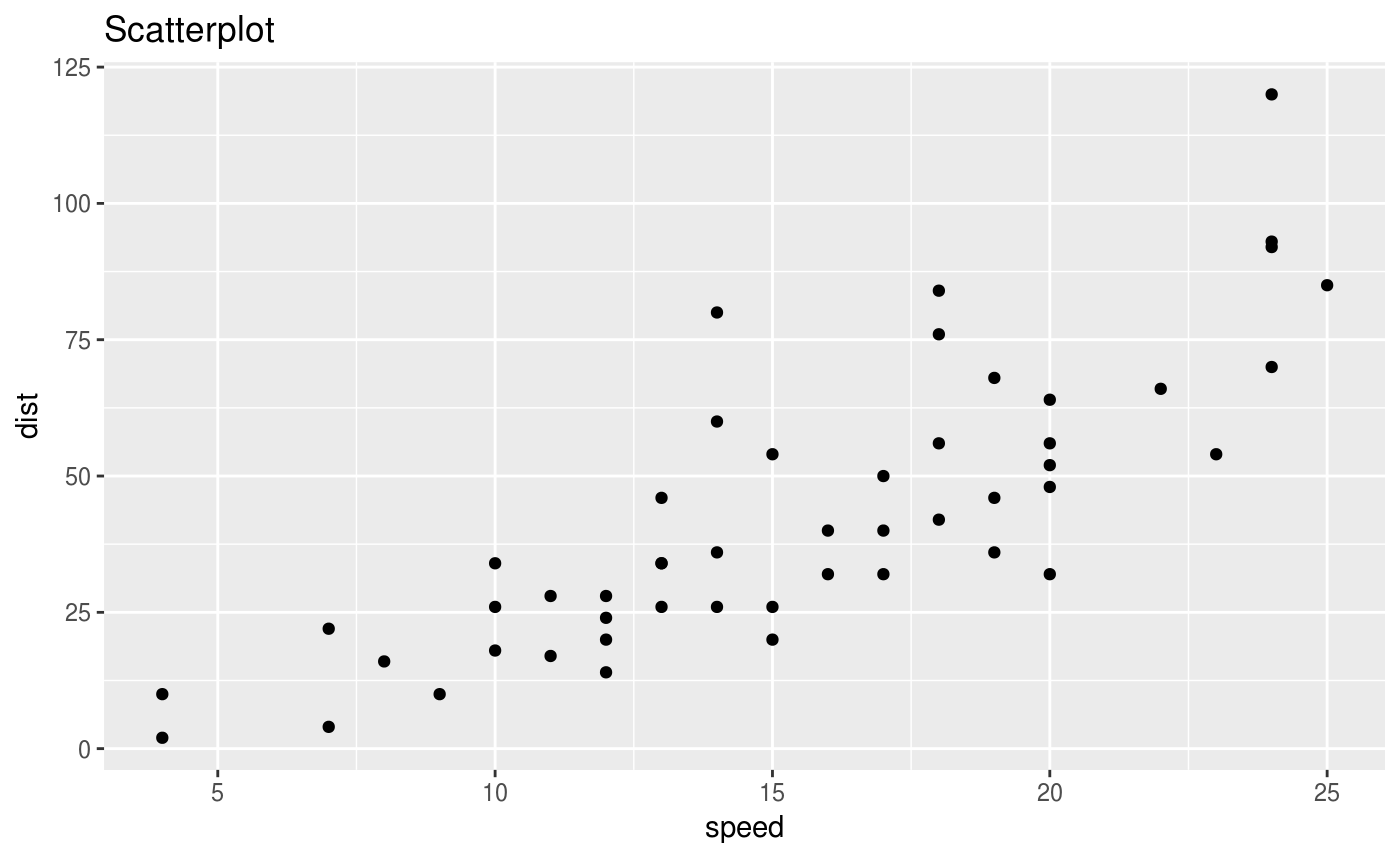
scatter()creates a scatterplot using ggplot
Functions
dsearch()
dsearch is a dichotomous search algorithm that will minimize univariate strictly pseudoconvex functions. Let us consider the quadratic function centered at 0:
# quadratic
x = seq(-5, 5, 0.1)
y = x^2
data = data.frame(x, y)
ggplot(data) + geom_line(mapping = aes(x, y, color = "red"), show.legend = FALSE) +
    ggtitle("y = x^2")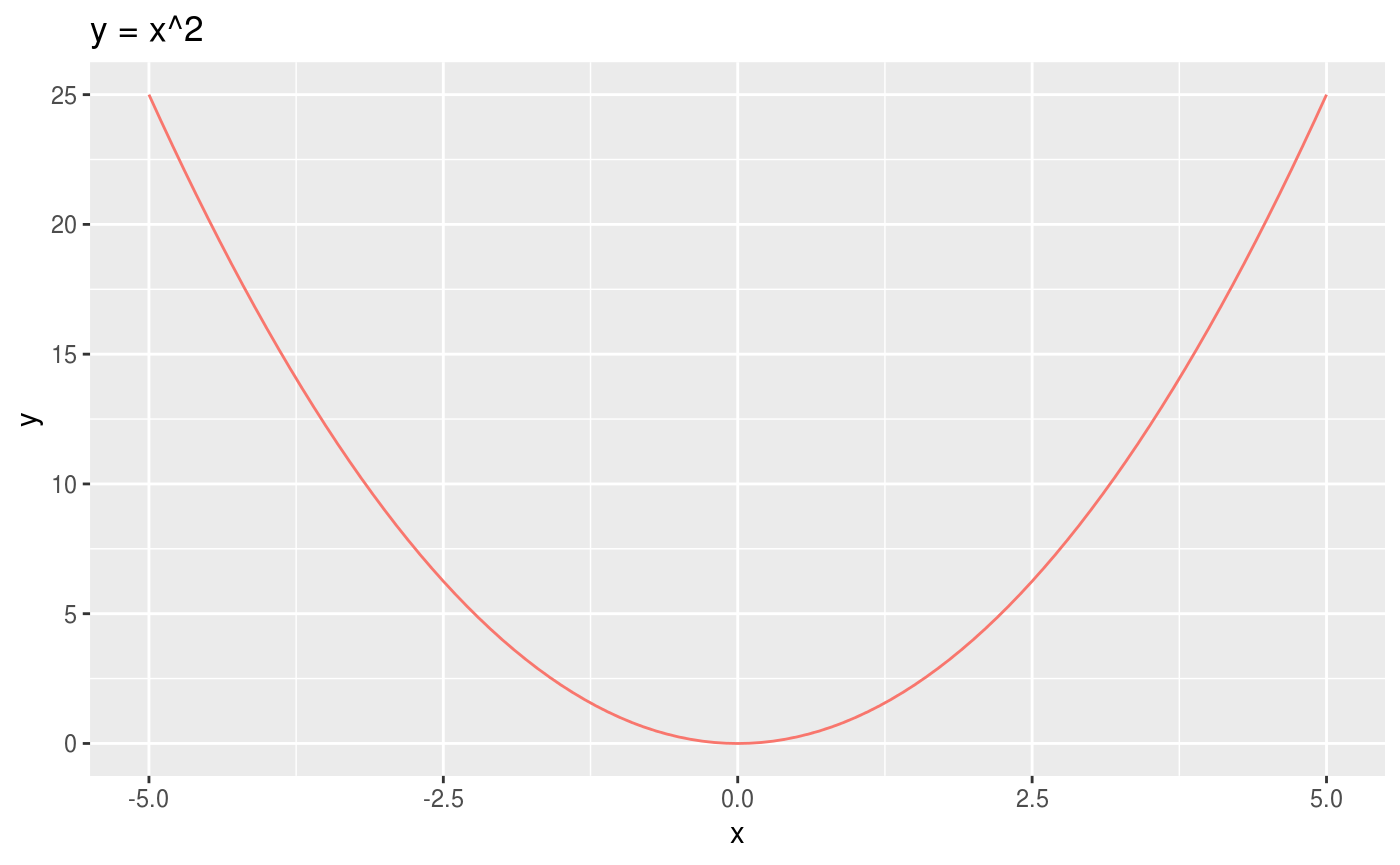
The minimum of this function clearly occurs at \(x = 0\) but we will confirm that with the dsearch function.
## new interval is -4.761905e-08 4.761905e-08## [1] 0We can see that dsearch confirms the minimum occurs at the suggested point.
bsearch()
bsearch is a bisection search algorithm that works very similarly to dsearch. The difference being that bsearch will find the root of the function – that is, when the function is equal to zero. Therefore, if we want to again minimize the quadratic function, we need to input the derivative of the quadratic function to find its minimum (recall that local minima and maxima occur when the derivative/gradient is equal to zero).
# derivative of quadratic
x = seq(-5, 5, 0.1)
dy = 2 * x
data = data.frame(x, dy)
ggplot(data) + geom_line(mapping = aes(x, dy, color = "red"), show.legend = FALSE) +
    ggtitle("dy = 2x")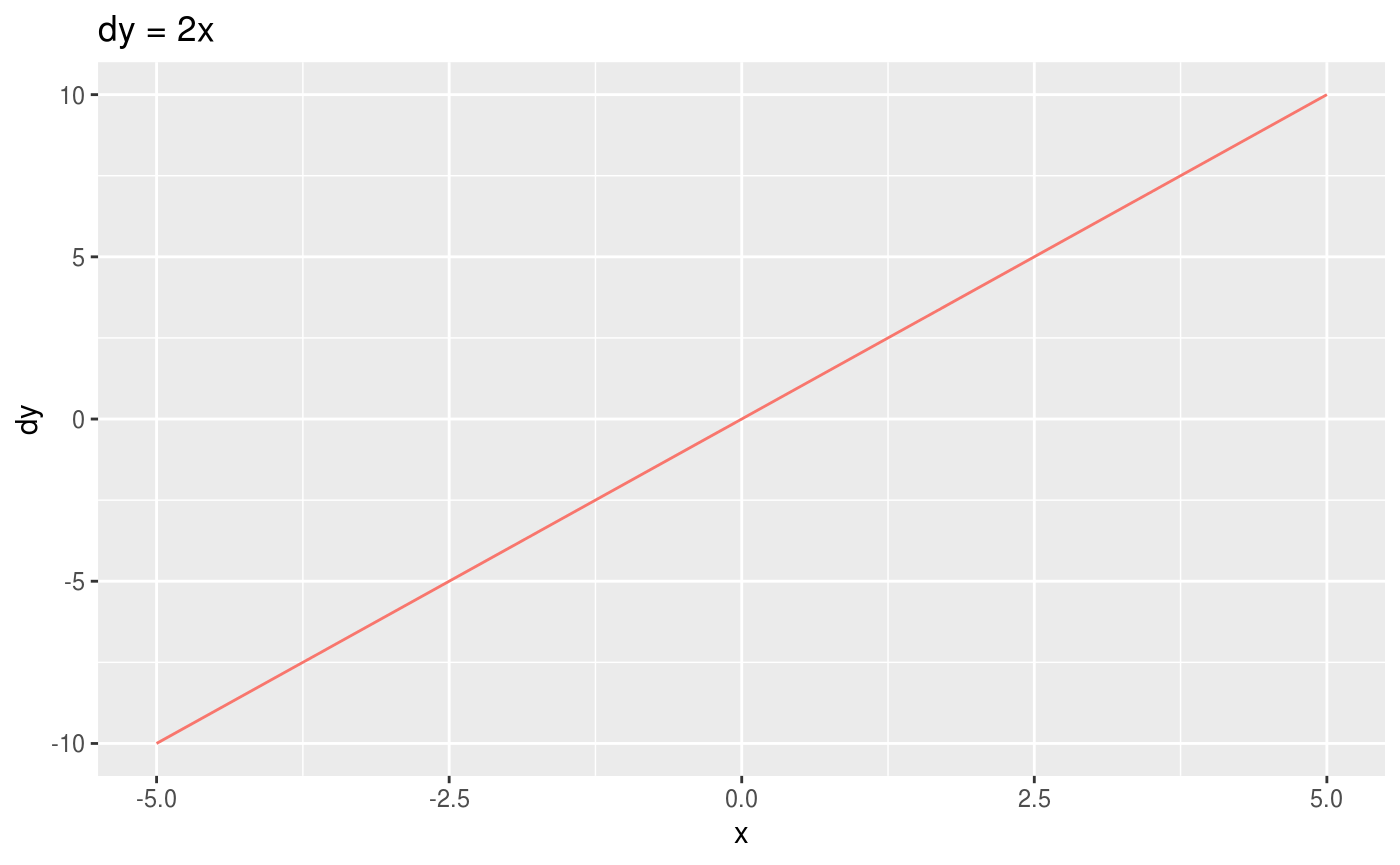
## new interval is 0 0## [1] 0We can see that bsearch confirms the minimum occurs at \(x = 0\).