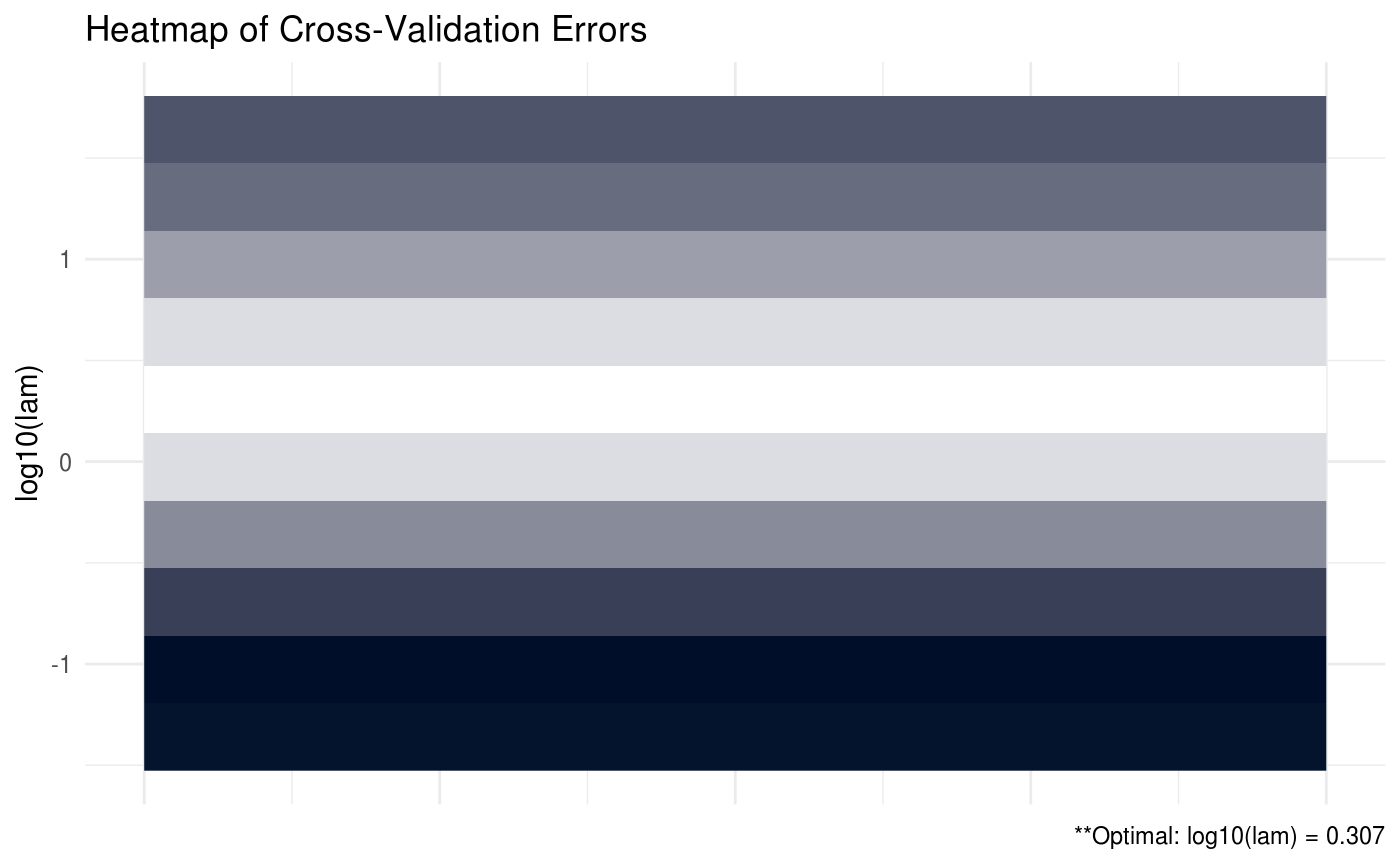
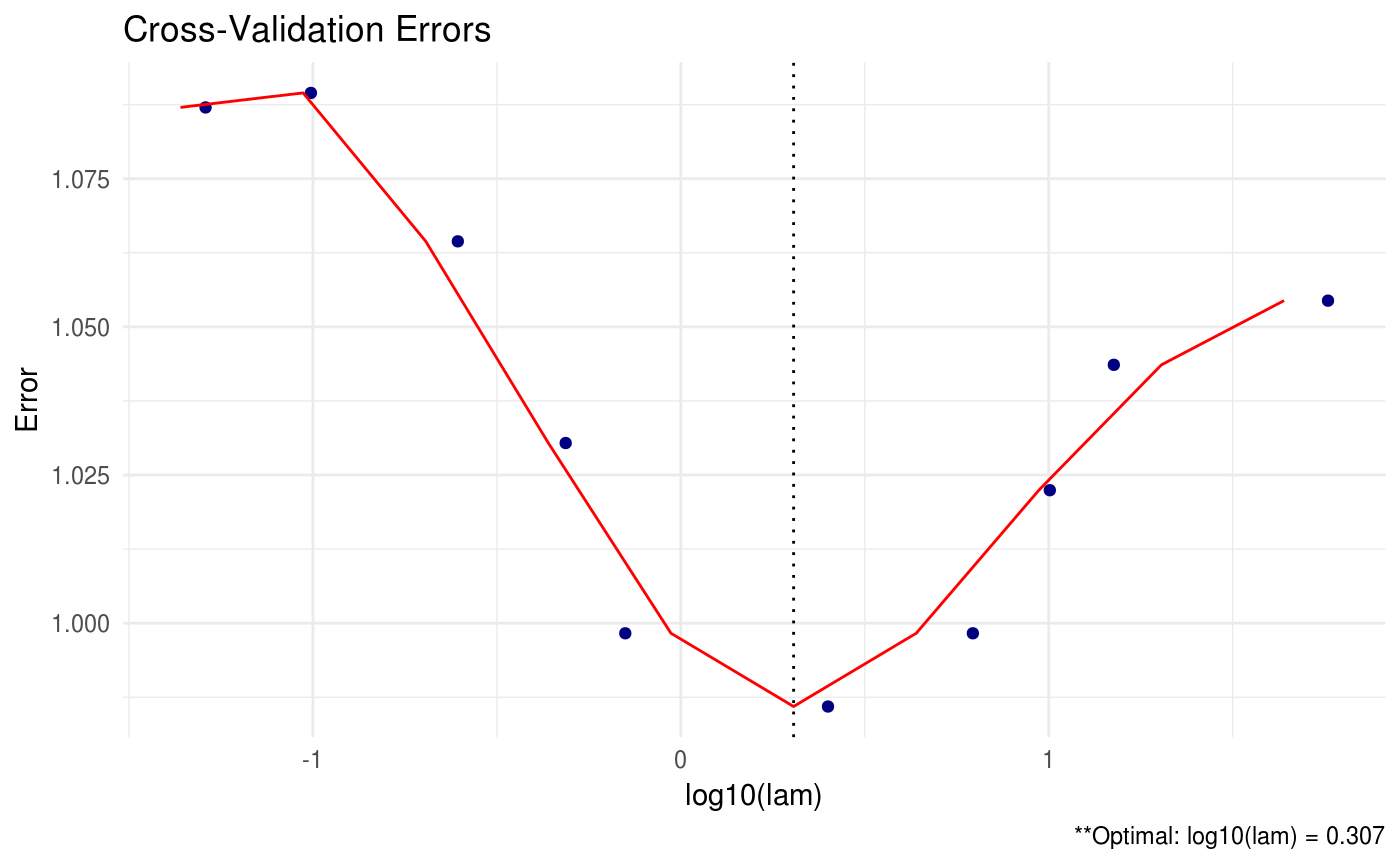
Produces a plot for the cross validation errors, if available.
# S3 method for shrink
plot(x, type = c("line", "heatmap"), footnote = TRUE, ...)
Arguments
| x | class object shrink. |
|---|---|
| type | produce either 'heatmap' or 'line' graph |
| footnote | option to print footnote of optimal values. Defaults to TRUE. |
| ... | additional arguments. |
Examples
# generate some data data = data_gen(n = 100, p = 5, r = 1) # lasso penalized beta (print estimated omega) lam.max = max(abs(t(data$X) %*% data$Y)) (shrink = shrink(X = data$X, Y = data$Y, B = cov(data$X, data$Y), lam.max = lam.max))#> #> Call: shrink(X = data$X, Y = data$Y, B = cov(data$X, data$Y), lam.max = lam.max) #> #> Iterations: 34 #> #> Tuning parameters: #> log10(lam) lam #> [1,] 0.307 2.026 #> #> Log-likelihood: -153.84938 #> #> Omega: #> [,1] [,2] [,3] [,4] [,5] #> [1,] 1.53191 -1.06296 -0.13706 -0.06565 -0.12001 #> [2,] -1.06296 2.31629 -1.06647 0.13630 -0.28381 #> [3,] -0.13706 -1.06647 2.49204 -0.87867 -0.39150 #> [4,] -0.06565 0.13630 -0.87867 2.22646 -0.87815 #> [5,] -0.12001 -0.28381 -0.39150 -0.87815 1.81671# print estimated beta shrink$Z#> [,1] #> [1,] 0.14183710 #> [2,] 0.09678515 #> [3,] 0.00000000 #> [4,] 0.00000000 #> [5,] 0.00000000# create heatmap of CV errors plot(shrink, type = 'heatmap')# create line graph of CV errors plot(shrink)