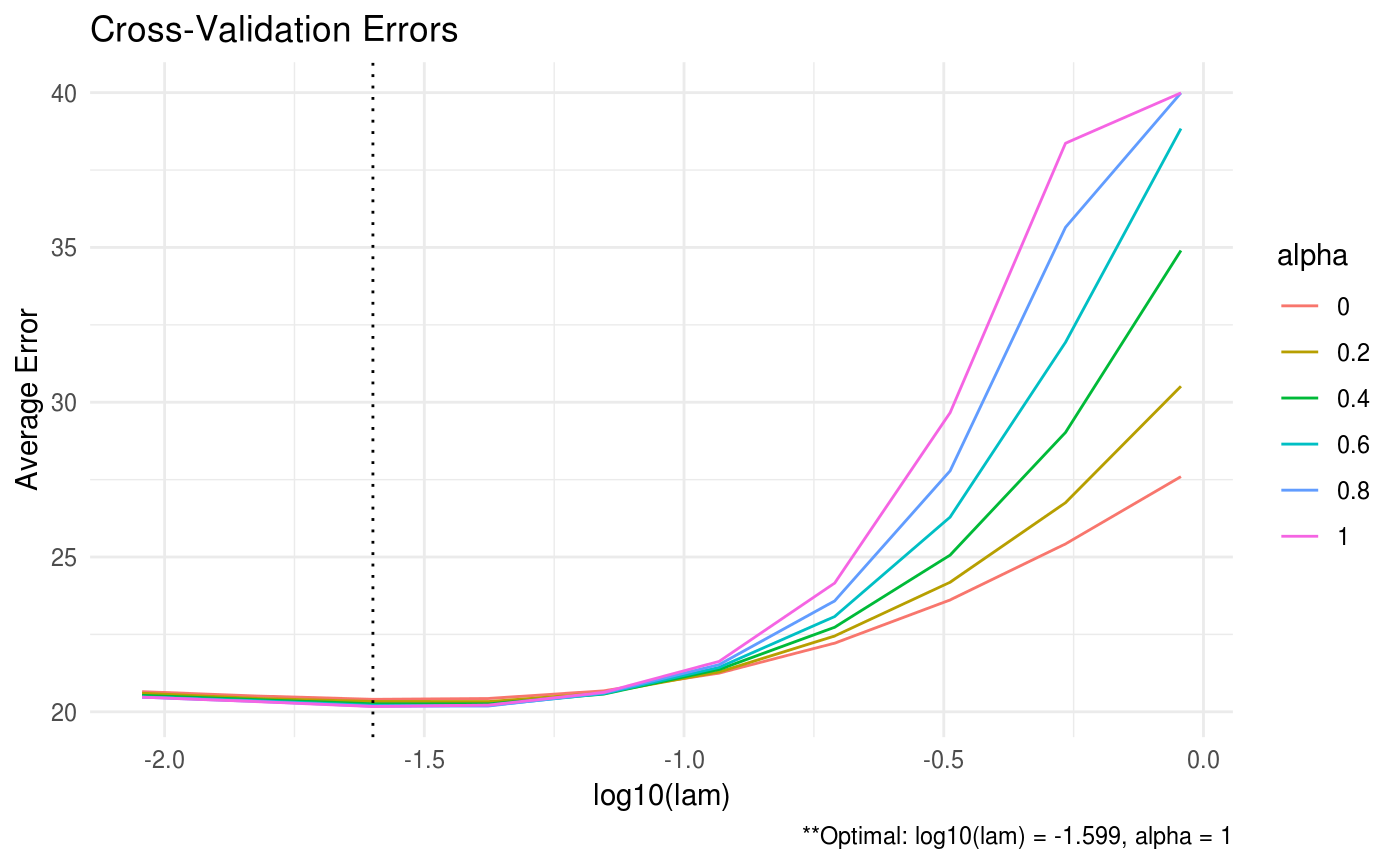
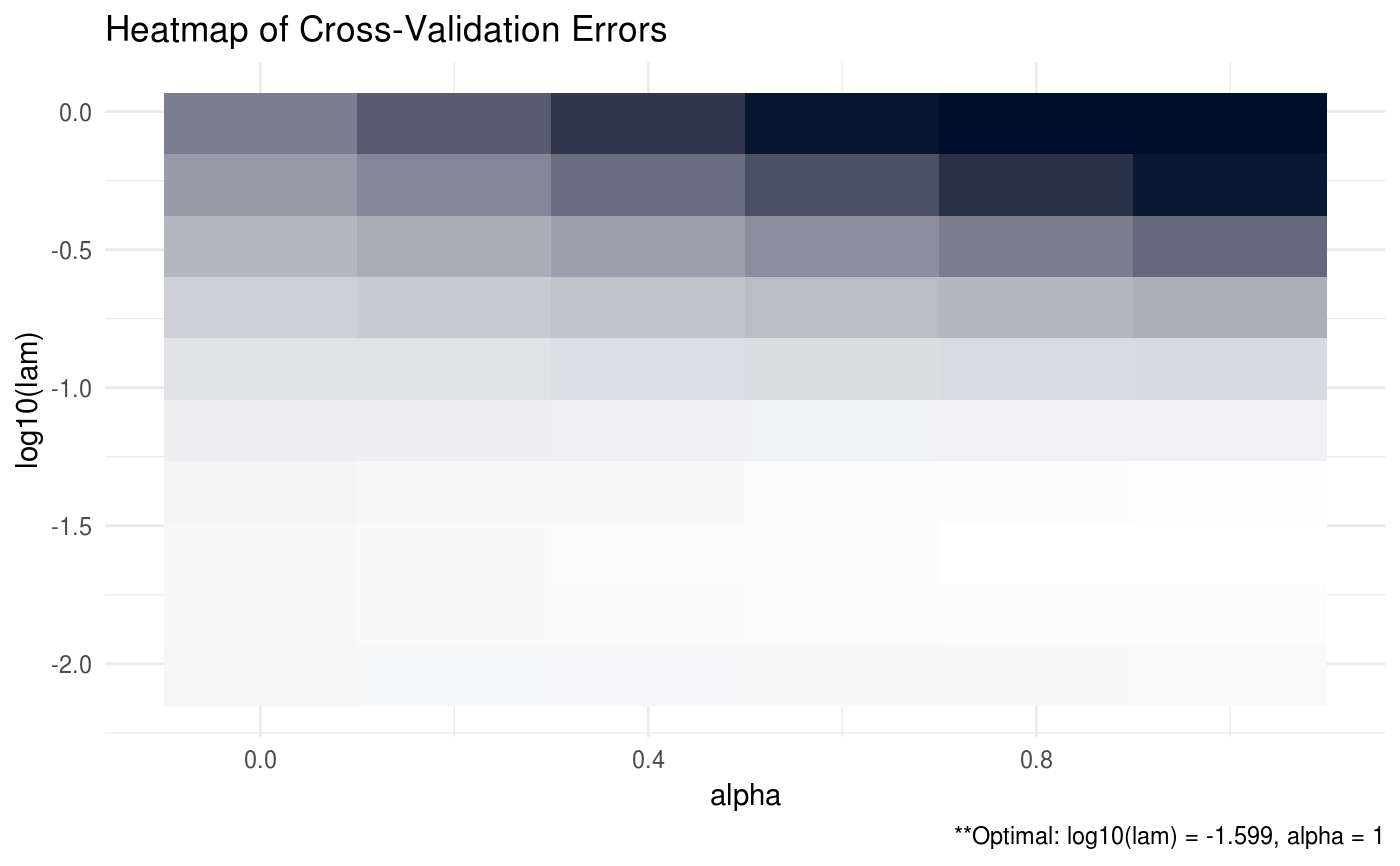
Produces a plot for the cross validation errors, if available.
# S3 method for ADMM
plot(x, type = c("line", "heatmap"), footnote = TRUE, ...)
Arguments
| x | class object ADMM. |
|---|---|
| type | produce either 'heatmap' or 'line' graph |
| footnote | option to print footnote of optimal values. Defaults to TRUE. |
| ... | additional arguments. |
Examples
# generate data from a sparse matrix # first compute covariance matrix S = matrix(0.7, nrow = 5, ncol = 5) for (i in 1:5){ for (j in 1:5){ S[i, j] = S[i, j]^abs(i - j) } } # generate 100 x 5 matrix with rows drawn from iid N_p(0, S) set.seed(123) Z = matrix(rnorm(100*5), nrow = 100, ncol = 5) out = eigen(S, symmetric = TRUE) S.sqrt = out$vectors %*% diag(out$values^0.5) S.sqrt = S.sqrt %*% t(out$vectors) X = Z %*% S.sqrt # produce line graph for ADMMsigma plot(ADMMsigma(X), type = 'line')